See how many people viewed your showcase
Every showcase has its own analytics for the last 30 days: how often it was seen, by how many people, and which sites sent them.
Open analytics
- Open the showcase from the Showcase page.
- In the top bar, click the Analytics button (the chart icon, “Views in the last 30 days”).
The analytics panel opens with the showcase name and its link name (slug) with “Last 30 days”.

On the Showcase page, each card also shows a quick count, such as “120 views · 30 days”. For a webpage that’s its visits; for a widget it’s its impressions.
What the numbers mean
A summary line at the top gives the headline: for a webpage, “N unique visitors in the last 30 days”; for a widget, “N impressions in the last 30 days”. Below it you see where most visits came from (“Most visits arrive from {site}.”), or “We don’t know which sites sent these visits.” when the sources are unknown.
Under Last 30 days:
| Metric | What it counts |
|---|---|
| Visits | Times someone opened the public page by its link. |
| Unique visitors | Different people, not repeat views by the same person. |
| Impressions | Times the showcase loaded inside a website through an embed. |
A chart shows visits and impressions per day over the 30 days.
Where visits come from lists the sites that sent visitors, with a count for each.
- Your own domain means the embed on your site is being seen.
- A social site means the link is being shared in posts.
- Few or no referring sites usually means people opened the link from an email, a DM, or a deal thread, which is typical for links sales teams send.
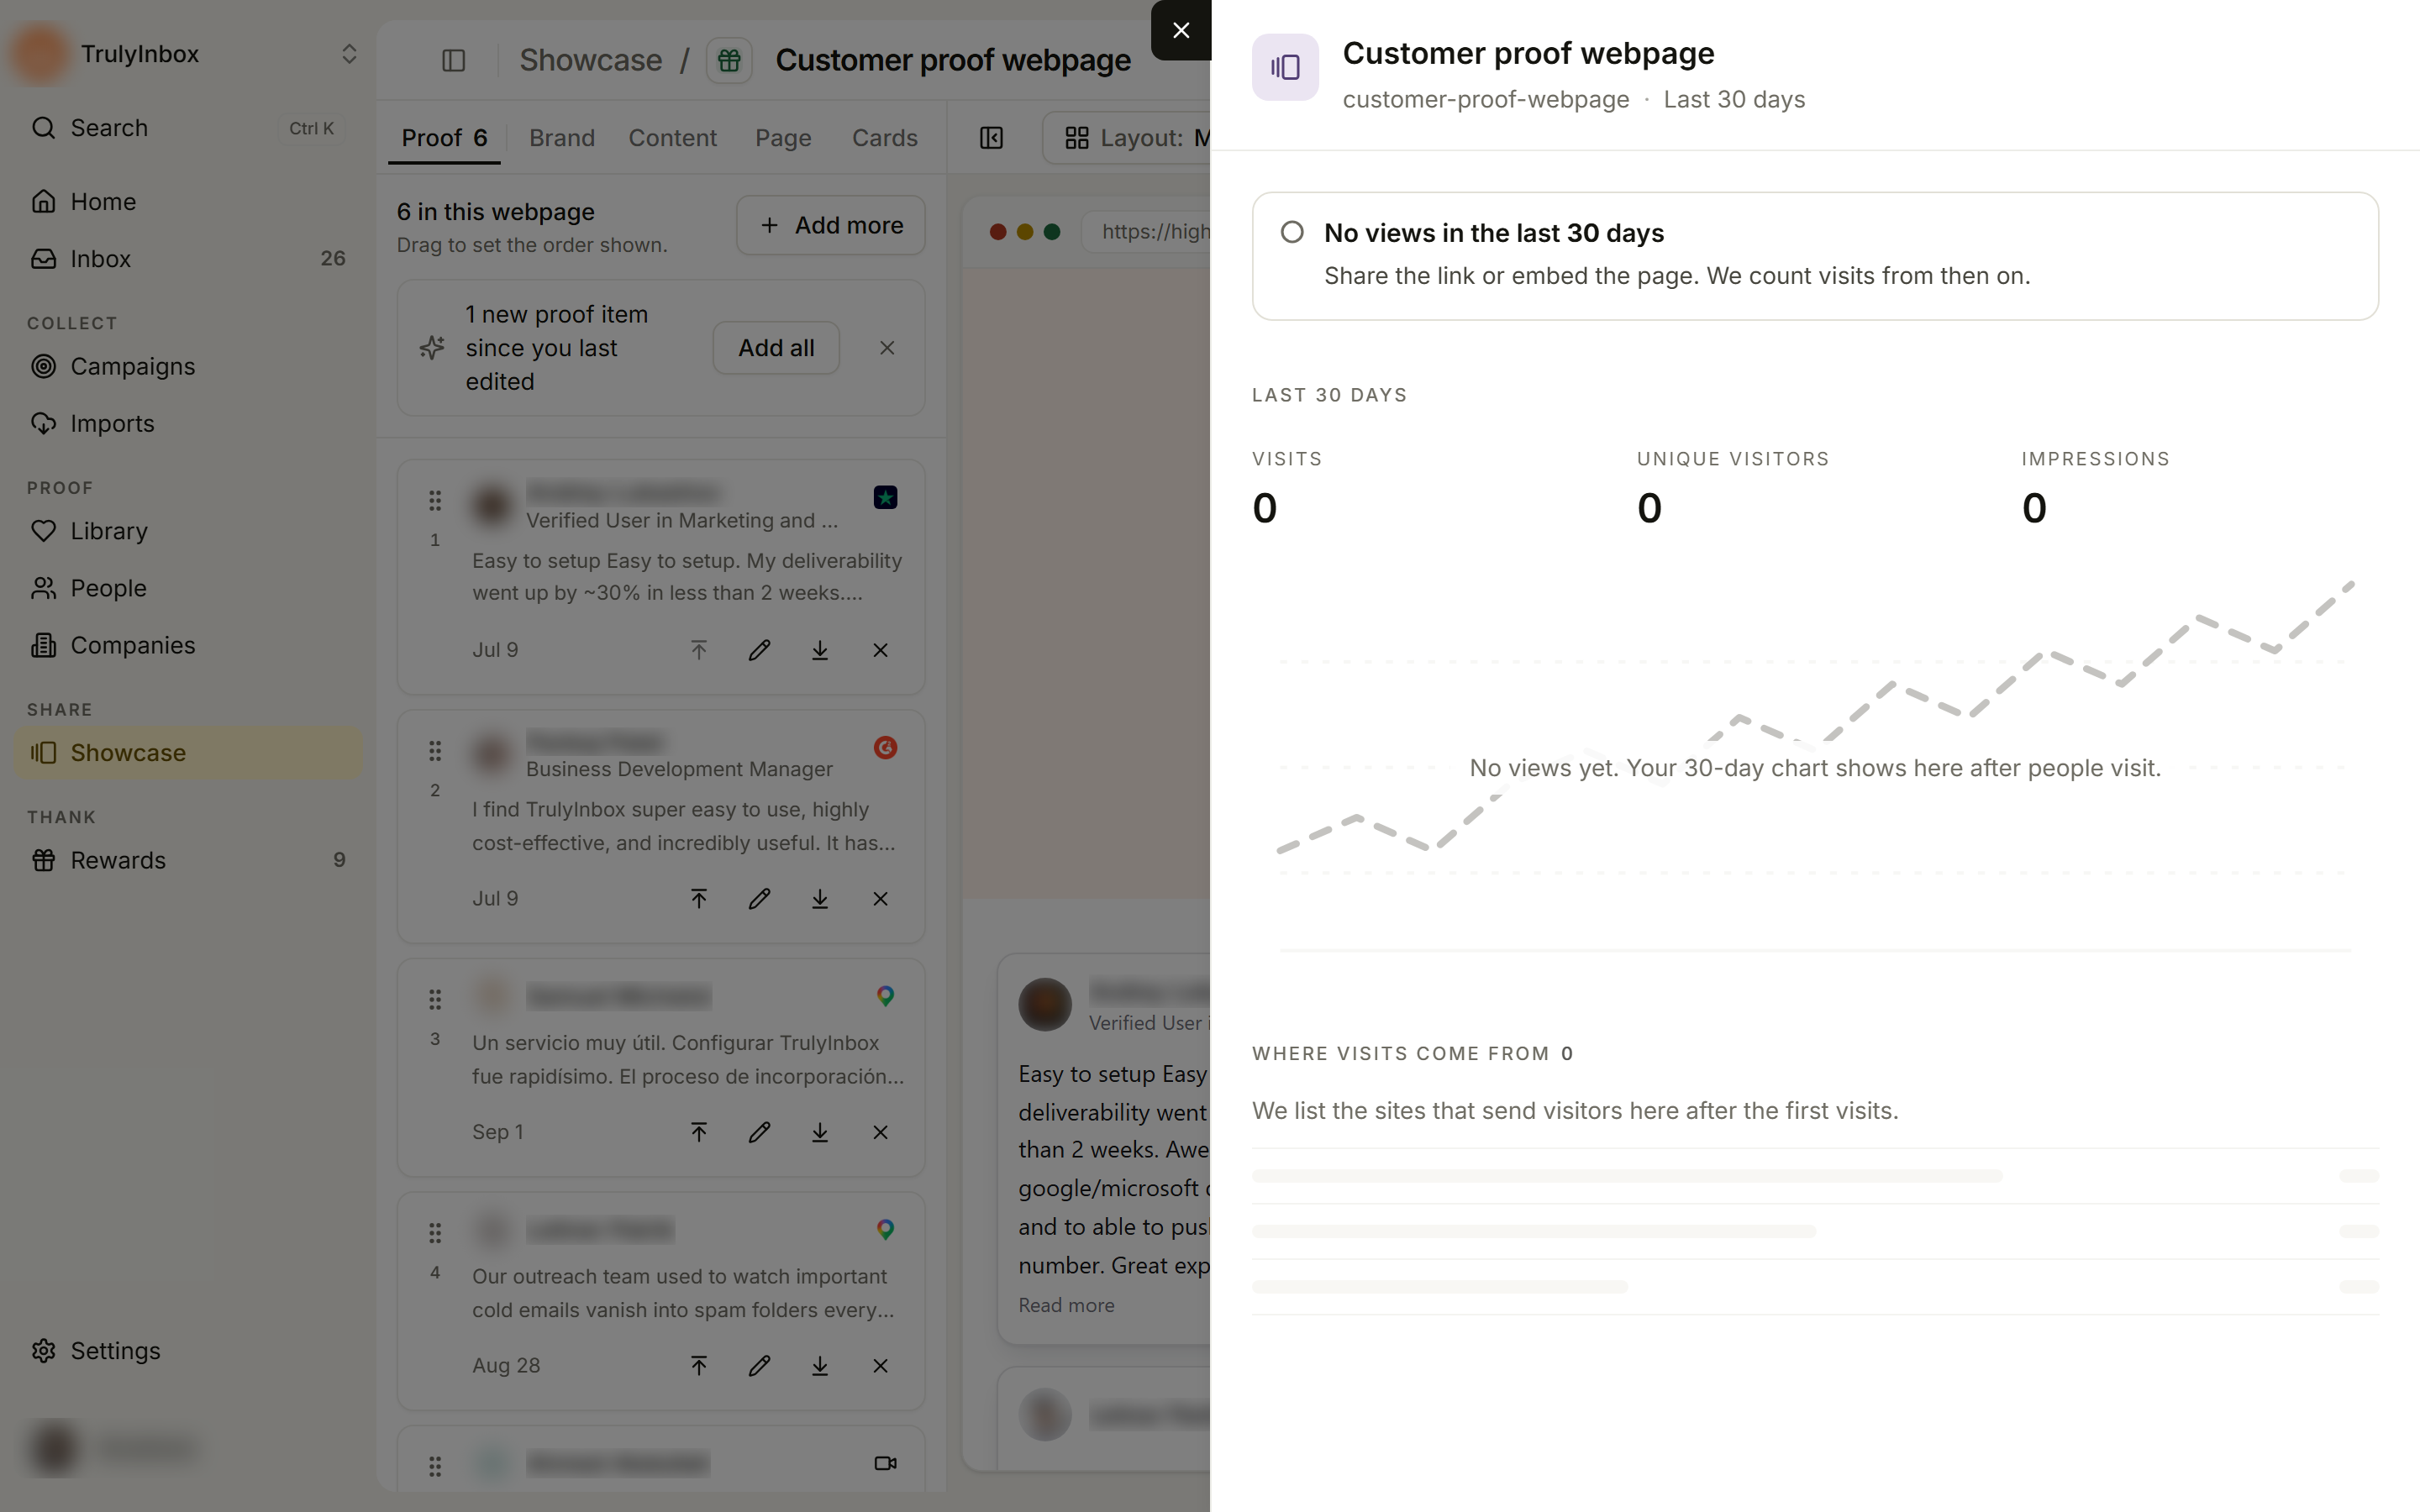
Before there is any data
- Not published yet: “We count views after the showcase has a public link. Publish it from Share.” See Publish, share, and embed.
- No views in the last 30 days: if the showcase isn’t live, the panel says “It’s not live, so the public page doesn’t open. Turn sharing on, then share the link.” If it is live, it says “Share the link or embed the page. We count visits from then on.”
- The chart reads “No views yet. Your 30-day chart shows here after people visit.” and Where visits come from reads “We list the sites that send visitors here after the first visits.”
Nothing is counted while the showcase is Not live, because the page and its embeds don’t show anything.
Showcase analytics vs campaign results
Showcase analytics measures who saw your proof after you published it. Campaign results measure how well you collected proof. For submissions and campaign performance, see Campaign results.
Related
- Publish, share, and embed: the Live switch that starts counting
- Campaign results: reporting on proof collection