
NPS is not a customer advocacy strategy. It's a temperature check.
If you're measuring advocacy success by NPS alone, you're missing 90% of the picture. That 72 NPS score on your executive dashboard? It tells you customers are happy. It tells you nothing about whether they're actually advocating for you.
The NPS Trap
Here's the uncomfortable truth: NPS measures intent, not action.
A customer who gives you a 9 or 10 has said they would recommend you. But will they:
- Actually write that G2 review?
- Post about you on LinkedIn?
- Refer a colleague when the opportunity arises?
Usually, no. The gap between NPS intent and advocacy action is massive.
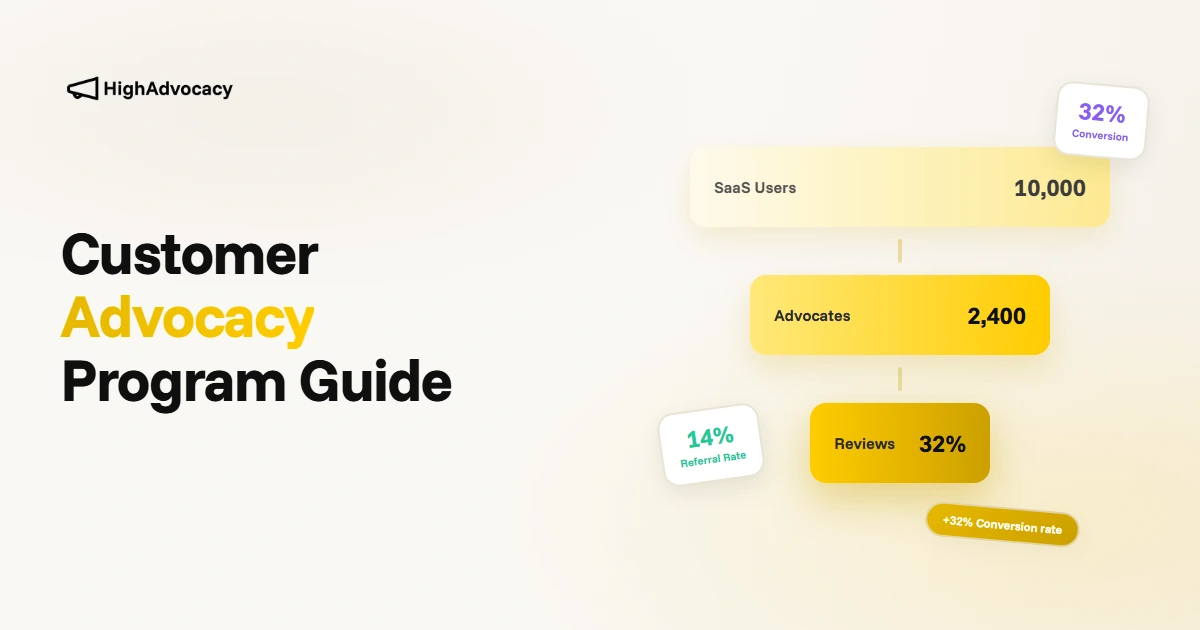
According to our analysis of 500+ B2B SaaS companies, only 8-12% of NPS promoters take any advocacy action in the following 90 days.
That's the advocacy gap you need to close--and you can't close what you don't measure.
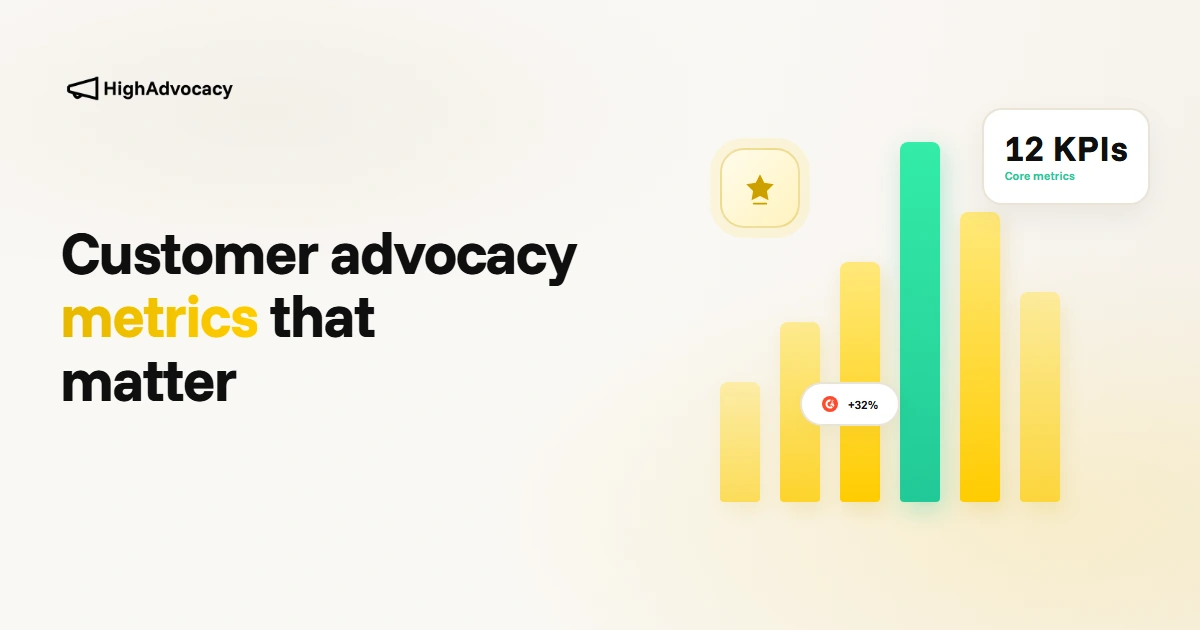
The Customer Advocacy Metrics Framework
We break advocacy metrics into three categories: Activity, Quality, and Impact.
Activity Metrics (Leading Indicators)
These tell you if your advocacy engine is running.
1. Advocacy Ask Rate
What it measures: Percentage of eligible customers who receive an advocacy request.
Why it matters: You can't get what you don't ask for. Most companies under-ask by a factor of 10x.
Formula: (Customers asked for advocacy / Total eligible customers) × 100
Benchmark: Top programs ask 60%+ of eligible customers. Most companies are under 10%.
2. Advocacy Response Rate
What it measures: Percentage of customers who complete an advocacy action after being asked.
Why it matters: Low response rates signal timing, targeting, or friction problems.
Formula: (Advocacy actions completed / Advocacy asks sent) × 100
Benchmark:
- Email-based asks: 5-15%
- In-app triggered asks: 20-40%
- Post-milestone asks: 30-50%
3. Review Velocity
What it measures: Number of new reviews per month across all platforms (G2, Capterra, TrustRadius, etc.).
Why it matters: Review platforms weight recency heavily. A burst of old reviews doesn't help you--consistent flow does.
Formula: New verified reviews / Time period
Benchmark: Target 1 review per 20-30 customers per month minimum.
4. Testimonial Pipeline
What it measures: Number of testimonials/quotes in various stages of approval.
Why it matters: Case studies and testimonials have long lead times. Track the pipeline, not just completions.
Stages to track:
- Requested
- Draft received
- Legal/brand approval pending
- Approved and published
Quality Metrics (Effort vs. Value)
These tell you if your advocacy is good.
5. Review Quality Score
What it measures: Average star rating + content depth across reviews.
Why it matters: A 3-star review with detailed criticism hurts more than it helps. Quality matters as much as quantity.
Components:
- Average star rating (target: 4.5+)
- Average word count (target: 100+ words)
- Percentage mentioning specific features
- Percentage including pros AND cons (more credible)
6. Advocacy Tier Distribution
What it measures: Distribution of advocacy actions across effort levels.
Why it matters: If all your advocacy is low-effort (reviews), you're leaving impact on the table. High-effort actions (case studies, referrals) drive more pipeline.
| Tier | Action | Target Mix |
|---|---|---|
| 1 | Survey response, NPS | 40% |
| 2 | G2/Capterra review | 30% |
| 3 | LinkedIn post, social share | 15% |
| 4 | Case study, video testimonial | 10% |
| 5 | Referral, speaking opportunity | 5% |
7. Advocate Repeat Rate
What it measures: Percentage of advocates who complete multiple advocacy actions.
Why it matters: One-and-done advocates are expensive. True champions compound over time.
Formula: (Advocates with 2+ actions / Total advocates) × 100
Benchmark: 25%+ repeat rate indicates healthy relationship depth.
Impact Metrics (Business Outcomes)
These connect advocacy to revenue--the only language executives understand.
8. Review-Influenced Pipeline
What it measures: Pipeline value from prospects who viewed your reviews before requesting a demo.
Why it matters: This proves reviews aren't just "nice to have"--they're sourcing and influencing real deals.
How to track:
- Add "How did you hear about us?" with G2/Capterra options
- Use G2 buyer intent data
- Track UTMs from review site CTAs
Benchmark: Top companies attribute 15-30% of pipeline to review influence.
9. Referral Revenue
What it measures: Closed-won revenue from customer referrals.
Why it matters: The ultimate advocacy metric. Referral deals close faster and retain better.
Track:
- Referral-sourced opportunities
- Referral win rate vs. other sources
- Average deal size from referrals
- Referral customer LTV
Benchmark: Referral win rates are typically 2-3x higher than cold outbound.
10. Advocacy-to-Expansion Correlation
What it measures: Correlation between advocacy actions and account expansion.
Why it matters: Advocates are typically your best expansion candidates. Track this connection.
Analysis: Compare expansion rates between:
- Accounts with 0 advocacy actions
- Accounts with 1+ advocacy actions
- Accounts with 3+ advocacy actions
Most companies see a 20-40% higher expansion rate among active advocates.
11. Share of Voice on Review Sites
What it measures: Your review volume and rating compared to competitors on key platforms.
Why it matters: Buyers compare options. Having more reviews and better ratings than competitors directly impacts win rate.
Track:
- Total review count vs. top 3 competitors
- Average rating vs. competitors
- Review recency (last 90 days) vs. competitors
- Category ranking position
12. Advocacy Program ROI
What it measures: Total return on advocacy investment.
Why it matters: Proves advocacy isn't a cost center--it's a revenue driver.
Formula:
ROI = (Referral Revenue + Review-Influenced Pipeline + Expansion from Advocates - Program Costs) / Program Costs
Program costs include:
- Incentive spend
- Software/tooling
- Team time
Benchmark: Well-run programs see 5-10x ROI.
Building Your Advocacy Dashboard
Here's a practical dashboard structure:
Weekly View (Operational)
- Advocacy asks sent
- Actions completed
- Reviews collected
- Response rate trends
Monthly View (Tactical)
- Review velocity
- Quality scores
- Advocate tier distribution
- Testimonial pipeline progress
Quarterly View (Strategic)
- Review-influenced pipeline
- Referral revenue
- Share of voice vs. competitors
- Program ROI
Moving Beyond NPS: A Practical First Step
You don't need to implement all 12 metrics tomorrow. Start here:
Week 1: Set up review velocity tracking (count new reviews weekly)
Week 2: Calculate your advocacy ask rate (probably lower than you think)
Week 3: Tag referral-sourced deals in your CRM
Week 4: Build your first advocacy dashboard with 3-5 metrics
The goal isn't perfect measurement--it's better measurement than "our NPS is 72."
The Advocacy Measurement Maturity Model
| Stage | Metrics Tracked | Typical Company |
|---|---|---|
| 1. Basic | NPS only | Most companies |
| 2. Activity | NPS + review count | Growing programs |
| 3. Quality | Activity + quality scores + tiering | Maturing programs |
| 4. Impact | All above + revenue attribution | Best-in-class |
Most companies are stuck at Stage 1. Getting to Stage 3 puts you ahead of 90% of competitors.
Stop Flying Blind on Advocacy
NPS told you customers were happy. These 12 metrics tell you what they're doing about it--and what it means for your business.
HighAdvocacy tracks all of these metrics automatically: from ask rates to review velocity to revenue attribution. No spreadsheets. No manual tagging. Just clear visibility into your advocacy program's real performance.